







There are huge differences in where R-loops are located within the human genome depending on which There are huge differences in where R-loops are located within the human genome depending on which R-loop mapping technology is used. Considering that misleading conclusions will be drawn if R-loops are mis-assigned, it is therefore of the highest priority to define a human R-loop map for the R-loop research community. Currently, it is premature to conclude which technology is superior to the others with regard to the precise mapping of R-loops. However, it is plausible that R-loop peaks supported by multiple technologies and exhibiting stronger R-loop signals are more likely bona fide R-loops. In contrast to R-loopBase V1, which provided a categorical map of human R-loops (Q6), the updated R-loopBase also introduces a quantitative scoring system that integrates all available R-loop mapping datasets into a unified mathematical framework. This enables continuous measurement of R-loop levels for direct comparison, correlation analysis, and statistical modeling. The quantitative map of R-loop regions is defined below. Notably, this approach can be applied to all R-loop mapping data from a given species or a specific cell type.
-
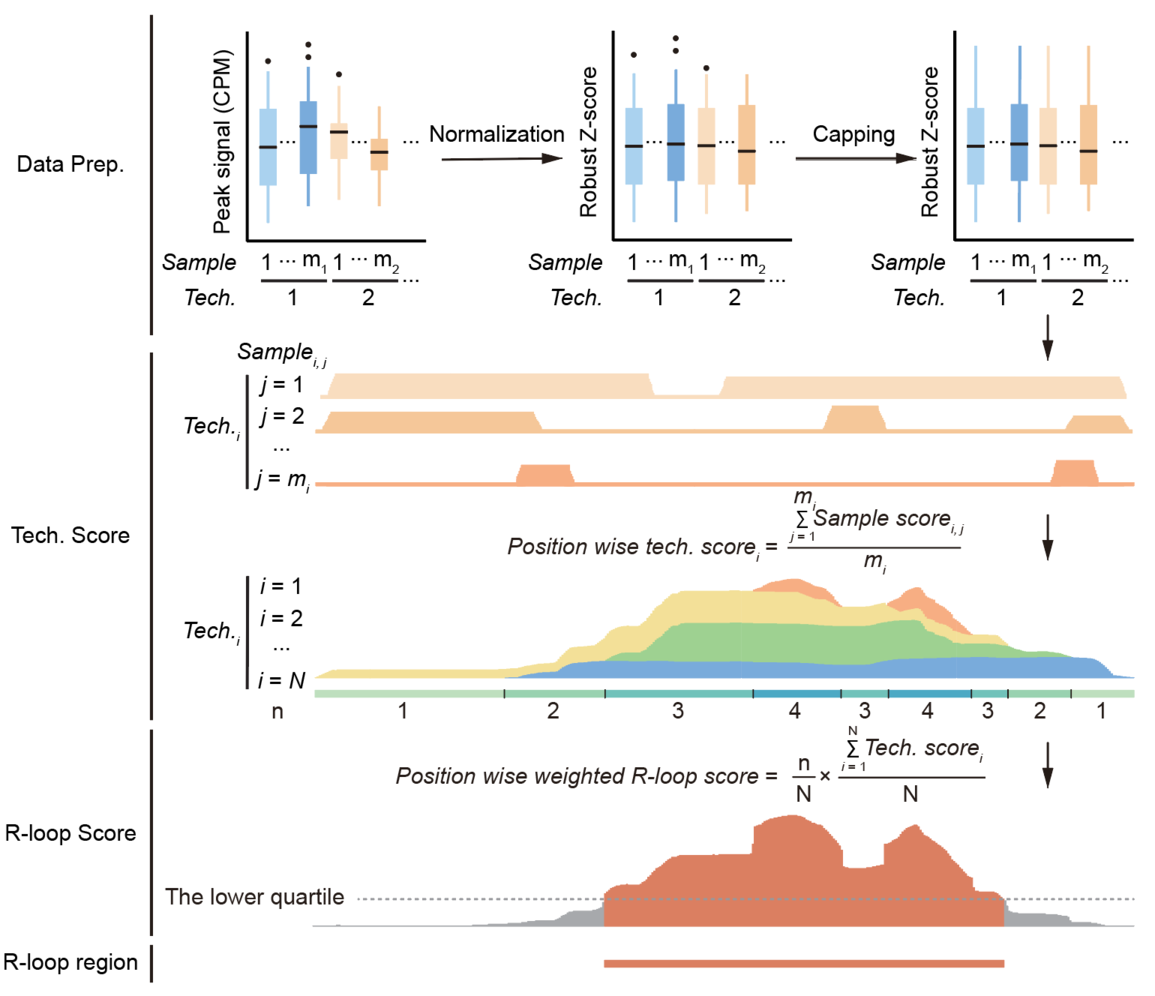
To facilitate cross-sample comparison, we applied a modified Robust Z-score to normalize the signal values of each sample. The modified Robust Z-score was calculated as (R-loop peak signal − lower fence) / MAD, and values greater than 10 were capped at 10.
-
Normalized R-loop signals were smoothed using a sliding window approach (window size = 100 bp; step size = 10 bp). For each R-loop mapping technology, the average R-loop signal across all samples was calculated for each window to obtain a technology score. For stranded R-loop mapping technologies, strand information was retained during computation to define the strandness of the final results. Meanwhile, Watson and Crick peaks were merged during the calculation to enable integration with non-stranded R-loop mapping technologies.
-
For non-strand specific data, technology scores were summed to obtain the R-loop score for each window. The summed window score was then multiplied by the number of technologies with a score greater than 0 in that window to yield the weighted R-loop score. The same procedure was applied to stranded R-loop technologies to obtain stranded R-loop score. Non-stranded R-loop score that overlapped with Watson or Crick R-loop scores were proportionally assigned to the Watson or Crick strand.
-
Contiguous regions with a score > 0 are highly likely to harbor R-loops. After excluding regions with R-loop scores below the lower quantile within each contiguous region, the remaining regions are considered high-confidence R-loop regions.